
Executive Overview
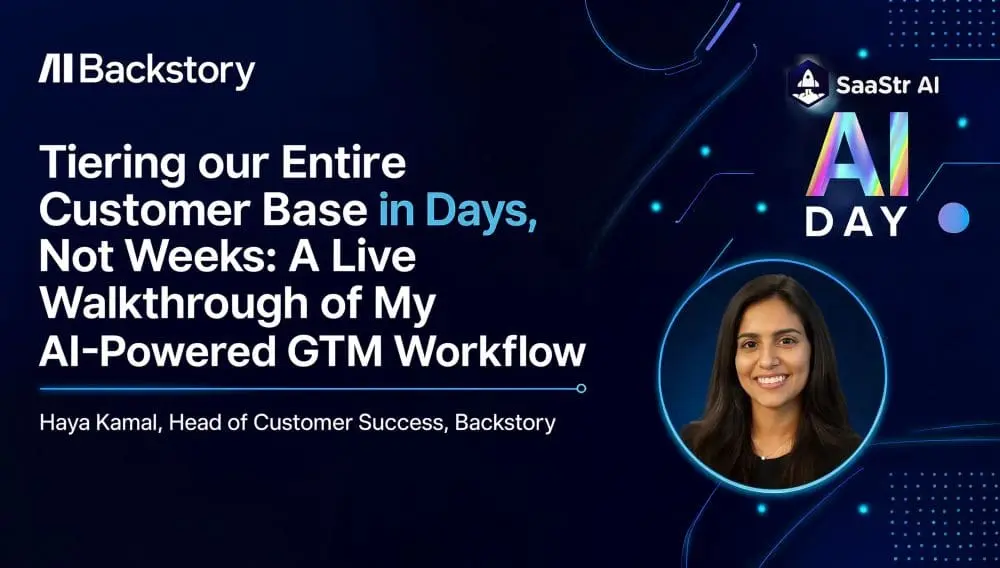
However, a recent presentation at SaaStr AI Day by Haya Kamola, Head of Customer Success at Backstory, demonstrated that this paradigm has fundamentally shifted. Faced with a board-mandated directive to tier 141 complex accounts under a tight deadline, Kamola bypassed traditional, labor-intensive methods. Leveraging custom AI connectors, automated signal extraction, and an iterative sequencing framework executed via Claude and Cowork, her team compressed a process that historically required a full quarter into just three to four days.
This case study examines Kamola’s methodology, dissecting the architectural framework, the critical role of human oversight in prompt engineering, the operational impact on field teams, and the broader implications for enterprise go-to-market strategies in the age of generative AI.
Detailed Chronology of the Project
The initiative began with a high-stakes directive from Backstory’s board of directors: evaluate 141 accounts, define the structural characteristics of the company’s most successful customers, measure the entire portfolio against those benchmarks, and produce a definitive, actionable tiering framework for executive leadership.
Rather than succumbing to the traditional trap of defaulting to existing, often poorly maintained CRM fields, Kamola engineered a sequential, seven-stage workflow that prioritized qualitative definition before quantitative data extraction.
Phase 1: Establishing the Qualitative Definition
Kamola initiated the project by gathering account teams and senior leadership to answer a foundational question: What separates a truly exceptional customer from an average one? The criteria deliberately bypassed standard vanity metrics such as contract tenure or sheer revenue size.
Instead, leadership defined their gold-standard accounts through behavioral and strategic markers:
- Platform Integration: Customers who treated Backstory as an irreplaceable core component of their tech stack, building operational systems directly around the platform.
- Long-Term Vision: Organizations that mapped out five-year strategic plans with Backstory positioned centrally.
- Collaborative Product Influence: Users who actively engaged with the product roadmap, offering feedback and anticipating future developments.
- Organic Expansion: Accounts that consistently discovered novel use cases, expanding the platform’s footprint across internal departments without prompting.
Only after this qualitative baseline was firmly established did the team transition to data modeling, ensuring that the scoring metrics reflected true strategic value rather than arbitrary database fields.
Phase 2: Generating Novel Signals
A major obstacle in account tiering is that the most predictive signals rarely exist in a structured, accessible format. Kamola divided these necessary data points into internal operational maturity and relationship-specific indicators.
Internal metrics included go-to-market process maturity, underlying tech stack composition, and organizational AI adoption velocity. Relationship metrics encompassed deployment velocity, executive visibility (the degree to which C-suite stakeholders used Backstory data for decision-making), total addressable market (TAM), and remaining white space.
Many of these metrics had never been systematically tracked across the entire customer base. To solve this, Backstory abandoned grueling manual categorization (such as their internal five-level AI maturity framework, which required account teams to manually assess culture, investment, technology, and talent). Instead, they engineered automated signals: programmatic prompts executed across CRM data, public company announcements, product launches, and chronological communication histories (including emails, meetings, and Slack transcripts) to output verified maturity scores alongside documented reasoning.
Phase 3: Cross-Functional Data Integration via Connectors
Historically, gathering these diverse data streams required an account owner to act as a corporate diplomat, petitioning product, BI, and finance teams for TAM, health metrics, revenue data, renewal timelines, delivery risks, and feature adoption levels.
Kamola eliminated inter-departmental friction by deploying four automated data connectors:
- Usage and Telemetry Connectors: Pulling real-time platform engagement data.
- Financial and CRM Connectors: Extracting contract values, renewal dates, and historical account notes.
- Product Feedback Connectors: Aggregating Jira boards and feature request backlogs.
- Communications Connectors (Slack): Ingesting internal team dialogues.
The Slack integration proved particularly revolutionary. Internal team chat channels typically house the earliest, most candid assessments of client sentiment, risk factors, and emerging opportunities—insights that rarely survive the trip into formal CRM logs. With these connectors active, the only manual intervention required was exporting a base CSV from Salesforce containing account names, executive engagement levels, predicted health scores, AI maturity ratings, renewal dates, and renewal Annual Contract Values (ACV).
Phase 4: Sequential Workflow Execution
Recognizing that the order of operations dictates the integrity of AI-generated analysis, Kamola structured the project using Claude and Cowork. Rather than executing a monolithic prompt, the analysis followed a strict, linear sequence:
- Ingestion & Normalization: Standardizing the Salesforce CSV so that account identities matched seamlessly across disparate data sources.
- Communication Analysis: Processing historical conversation logs as the primary source of truth for recent engagement, emerging risks, and unexploited opportunities.
- Utilization Auditing: Evaluating actual platform usage metrics against historical norms.
- Growth Potential Calculation: Cross-referencing Salesforce data with public research. Because Backstory prices its software per seat based on go-to-market headcount, the size of a client’s GTM organization served as the definitive TAM indicator, while the delta between total headcount and current licensed seats revealed immediate expansion white space.
- Jira & Gap Integration: Factoring in product feature requests and engineering feedback boards.
- Reconciliation & Scoring: Synthesizing all data points into a unified scoring model.
A complete analytical run required approximately 20 minutes of processing time.
Phase 5: Iteration and Error Correction
Kamola stressed that the version showcased at SaaStr AI Day was the product of three or four rigorous rounds of iteration. This iterative phase highlighted the indispensable nature of human oversight in AI-driven workflows.
Initially, the model evaluated roughly eight distinct signals, but this abundance of variables created data contradictions that obscured the core narrative. The framework was subsequently streamlined into four primary scoring buckets:
- Growth potential within the account.
- AI maturity and internal adoption velocity.
- Stakeholder engagement quality (including customer perception and seniority of contacts).
- Current account health.
More importantly, iteration exposed a critical analytical flaw in the initial scoring logic. The first version of the model treated a high volume of feature requests as a negative indicator, docking points for health and engagement under the assumption that frequent requests signaled customer dissatisfaction.
When cross-referenced against actual data, the exact opposite proved true: the company’s highest-adopting customers correlated strongly with high feature request volumes. Deep platform adoption paired with a steady stream of forward-thinking product requests was actually a premier indicator of an expanding, highly engaged account—an error that would have remained hidden in a traditionally constructed, unverified scoring model.
Supporting Context & Metrics
The culmination of this automated process yielded a four-tier segmentation framework that fundamentally redefined resource allocation across the business:
- Tier A Accounts: High-potential, highly mature customers requiring strategic executive sponsorship and proactive quarterly business reviews.
- Tier B Accounts: Core accounts demonstrating strong health and steady utilization, managed through standard, scalable customer success playbooks.
- Tier C Accounts: Stable accounts with limited expansion potential, transitioned to automated, low-touch engagement models to preserve human capital.
- Tier D Accounts: At-risk or stagnant accounts that forced leadership to confront hard truths regarding whether these clients warranted ongoing investment or strategic divestment.
By casting light on Tier D accounts, the analysis prevented zombie accounts from quietly draining customer success bandwidth. Furthermore, the operational efficiency gains were stark: a process that historically demanded hundreds of hours across multiple departments was compressed into a 20-minute computational run executed over a long weekend.
Official Statements & Industry Implications
Reflecting on the execution of the project, Kamola noted the hazard of moving too quickly—highlighting a lighthearted moment during her live demonstration when she temporarily forgot to attach the master CSV before initiating the prompt, observing, "That’s what happens when you start moving too fast."
More broadly, Kamola’s framework challenges the conventional wisdom surrounding enterprise go-to-market planning. By demonstrating that AI agents and structured prompt sequencing can synthesize unstructured communication data with quantitative CRM metrics, Backstory has established a new benchmark for operational agility.
Industry analysts point out that this methodology shifts the role of the GTM leader from data collector to strategic validator. When AI can ingest Slack discussions, Jira tickets, and public market data to construct a nuanced health score in minutes, the competitive advantage belongs to organizations that can rapidly interpret those insights and execute operational changes in the field.
Future Outlook
Following the success of this inaugural exercise, Backstory has committed to running the account tiering workflow on a strict quarterly cadence. This recurring schedule will serve a dual purpose: tracking longitudinal account migration between tiers and dynamically refining tier definitions when market conditions or product evolutions render previous benchmarks obsolete.
The immediate operational impact on field teams has been profound. Customer success managers now possess granular, data-backed clarity regarding where to invest their time, which accounts are genuinely primed for expansion, and which relationships require immediate intervention or strategic pruning.
While the current iteration focuses exclusively on existing customer accounts—relying as it does on utilization metrics, conversation logs, and historical feature gaps—Kamola and her team are actively exploring the development of a pre-market version. By adapting the ingestion connectors to analyze prospect data, public filings, and early discovery calls, Backstory aims to bring the same speed, rigor, and predictive accuracy to top-of-funnel outbound sales strategies.
For go-to-market leaders grappling with complex portfolios and board-level pressure for operational efficiency, Kamola’s methodology offers a clear blueprint: define your success criteria qualitatively, automate signal extraction across siloed communication and data channels, maintain rigorous human oversight through iterative prompt validation, and let intelligent automation handle the heavy lifting.