
Executive Overview
In the modern enterprise, this traditional, manual approach to analytics is no longer sustainable. Speed to insight is everything, yet data teams remain bogged down by the administrative friction of report generation.
Fortunately, the paradigm is shifting. By combining the data-wrangling power of Python with the natural language reasoning of advanced generative artificial intelligence—specifically models like Claude Opus 4.8—analysts can now automate the entire pipeline. This modern workflow ingests raw transactional logs, cleans anomalies, aggregates core performance metrics, generates visual charts, and drafts nuanced, executive-level summaries in a matter of seconds.
This article explores a comprehensive, reproducible workflow that demonstrates how to transform a raw sales CSV into a self-contained, beautifully formatted HTML executive report. While the AI acts as a tireless co-pilot capable of drafting narratives and identifying initial trends, the human analyst remains firmly in control—validating the data integrity, contextualizing sample sizes, and ensuring that strategic recommendations are grounded in reality.

Detailed Chronology: Building the Automated Analysis Pipeline
To understand how automation streamlines this process, we can trace the development of a Python-based reporting pipeline from raw data ingestion to final HTML rendering. The methodology follows a strict, logical progression:
$$textCSV Ingestion longrightarrow textData Cleaning longrightarrow textExploratory Analysis longrightarrow textData Visualization longrightarrow textAI Insight Generation longrightarrow textHTML Report Assembly$$
1. Ingesting and Inspecting the Raw Data
The process begins with a standard transactional dataset, product_sales.csv, containing payment events, purchase dates, monetary amounts, and fulfillment statuses. Utilizing Python’s robust data manipulation library, Pandas, the file is loaded into memory:
import pandas as pd

df = pd.read_csv("product_sales.csv")
A preliminary inspection of the dataset reveals immediate hazards that would trip up unverified automated tools. For instance, refunds are recorded as negative monetary values, and not every transaction represents a settled sale; some rows contain pending or failed payment statuses.

2. Rigorous Data Cleaning
To ensure reporting accuracy, the pipeline enforces strict validation rules. Pending and failed transactions are stripped away, preventing false revenue inflation, while date-time and numeric formats are standardized:
df["transaction_date"] = pd.to_datetime(df["transaction_date"])
df["amount"] = pd.to_numeric(df["amount"], errors="coerce")

# Isolate settled revenue; filter out pending and failed transactions
settled = df[df["status"] == "completed"].copy()
settled["is_refund"] = settled["type"].eq("refund")
In a test dataset of 45 rows, this cleaning step drops 3 unverified entries, leaving 42 legitimate, completed transactions. Failing to execute this step would result in reporting inaccurate financial baselines to leadership.
3. Exploratory Data Analysis & Metric Aggregation
With a clean dataset established, the pipeline addresses core business questions: How much revenue was retained over the operating period, and where did the capital leak?
By separating gross purchases from refunds, net revenue is calculated directly from the adjusted amount column:
gross = settled.loc[~settled["is_refund"], "amount"].sum()
refunds = settled.loc[settled["is_refund"], "amount"].sum()   # Negative value
net = settled["amount"].sum()
refund_rate = -refunds / gross

print(f"Gross Revenue: $gross:,.0f")
print(f"Total Refunds: $refunds:,.0f")
print(f"Net Revenue:   $net:,.0f")
print(f"Refund Rate:   refund_rate:.0%")
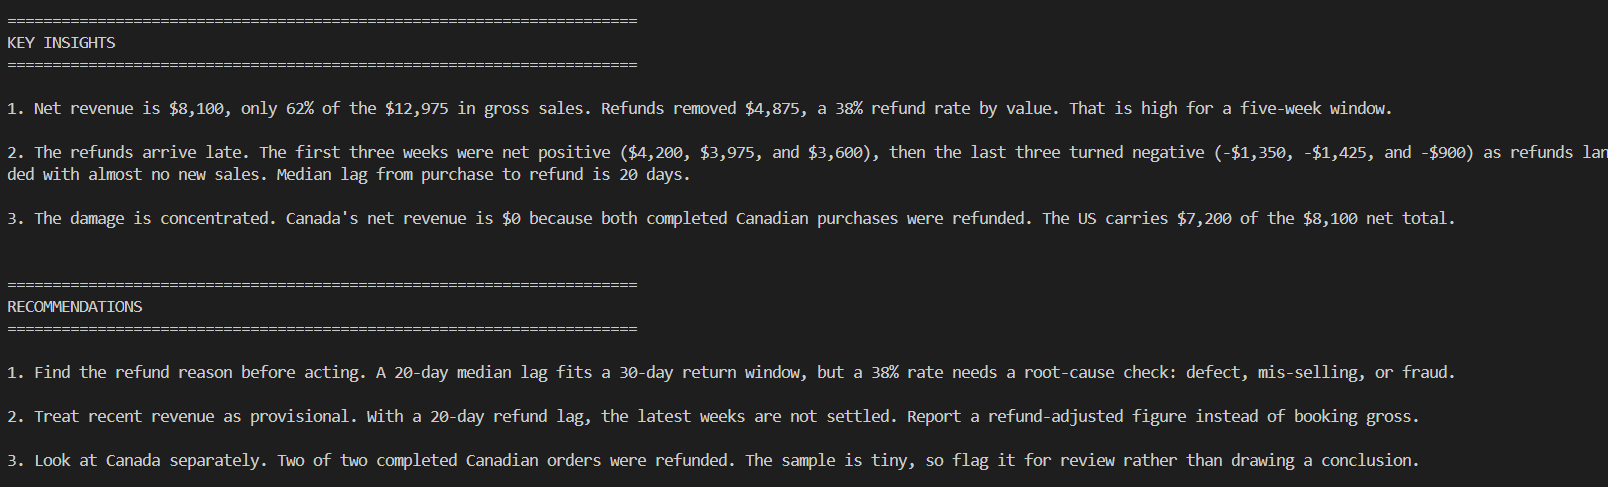
The resulting baseline figures tell a compelling story: $12,975 in gross sales offset by $4,875 in refunds, yielding a net revenue of $8,100—alongside a striking 38% refund rate by value.
Supporting Context & Metrics: Uncovering Hidden Trends
A top-line net revenue figure is rarely sufficient for executive decision-making. Leadership requires granular visibility into geographic performance, temporal trends, and operational lag times.
Geographic and Temporal Breakdowns
Grouping the settled transactions by country reveals unexpected anomalies in market performance:
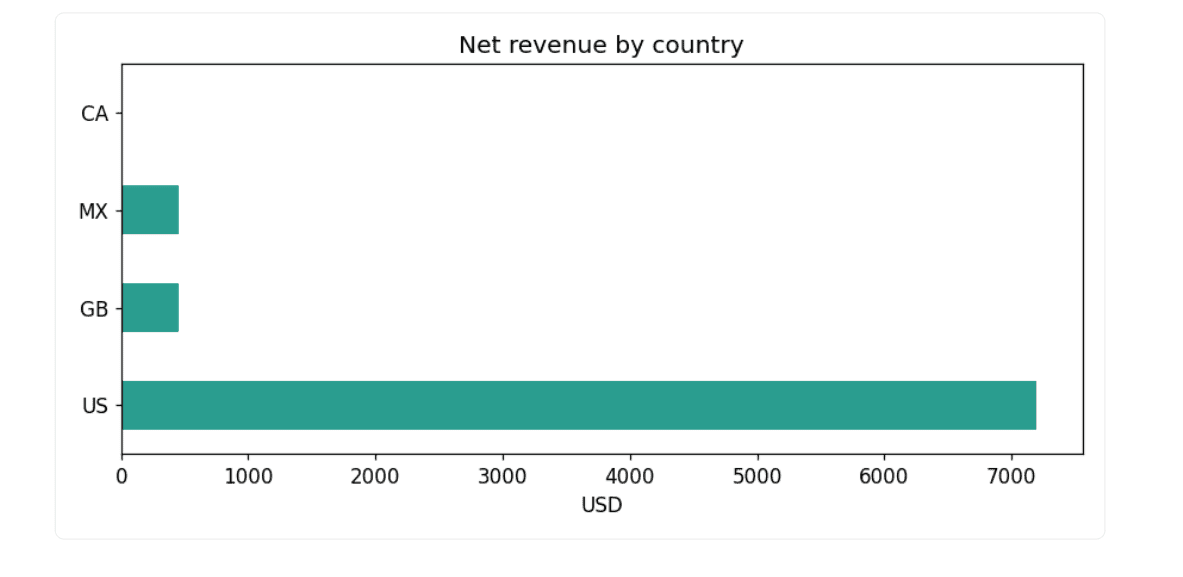
- United States: $7,199.84 net revenue across 38 transactions.
- Great Britain & Mexico: $449.99 net revenue each (1 transaction each).
- Canada: $0.00 net revenue (2 completed orders, both subsequently fully refunded).
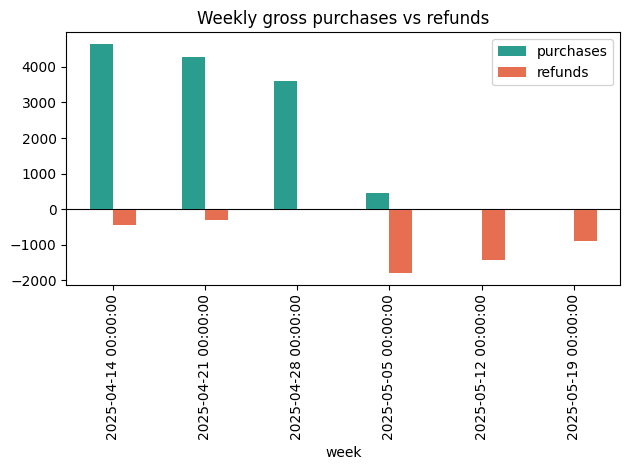
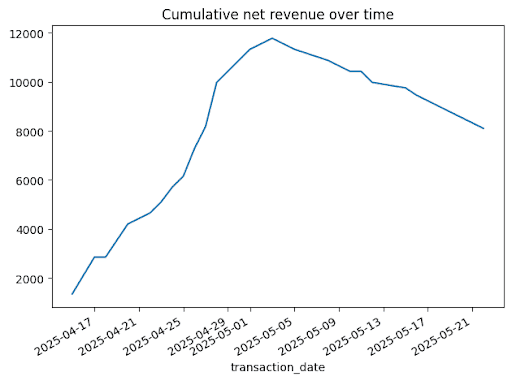
When analyzed weekly, a stark operational shift emerges. The first three weeks of the operating period are robustly net-positive, while the final three weeks plunge into negative net revenue as incoming purchases dry up while historical refunds continue to process:
| Week Starting | Purchases ($) | Refunds ($) | Net Revenue ($) |
|---|---|---|---|
| 2025-04-14 | 4,649.89 | -449.99 | 4,199.90 |
| 2025-04-21 | 4,274.90 | -299.99 | 3,974.91 |
| 2025-04-28 | 3,599.92 | 0.00 | 3,599.92 |
| 2025-05-05 | 449.99 | -1,799.96 | -1,349.97 |
| 2025-05-12 | 0.00 | -1,424.96 | -1,424.96 |
| 2025-05-19 | 0.00 | -899.98 | -899.98 |
Measuring Refund Lag Times
By mapping each refund back to its original transaction identifier via original_transaction_id, the pipeline calculates the operational lag time between purchase and refund:
purch_dates = (settled.loc[~settled["is_refund"], ["transaction_id", "transaction_date"]]
               .set_index("transaction_id")["transaction_date"])
ref = settled[settled["is_refund"]].copy()
ref["lag_days"] = (ref["transaction_date"]
                   - ref["original_transaction_id"].map(purch_dates)).dt.days

print(f"Median Refund Lag: ref['lag_days'].median() days")
The data reveals a median refund lag of 20 days, explaining why April’s high-volume sales continued to generate financial drag well into the month of May.
Official Integration: Leveraging Generative AI for Narrative Drafting
While Python excels at data aggregation and plotting visual charts with libraries like Matplotlib, drafting executive summaries traditionally consumes valuable analyst hours. This is where advanced language models step in.
Instead of exposing raw, row-level transactional data—which raises privacy and security concerns—the pipeline formats the clean, aggregated metrics into a concise text summary:
summary = f"""Product sales, settled['transaction_date'].min().date() to settled['transaction_date'].max().date().
Gross: $gross:,.0f  Refunds: $-refunds:,.0f  Net: $net:,.0f
Refund rate by value: refund_rate:.0%
Net revenue by country: by_country['net_revenue'].round(0).to_dict()
Weekly net: weekly_net
Median days from purchase to refund: 20"""

prompt = (
    "You are a data analyst writing for executives. "
    "Based on this summary, write 3 insights and 3 business "
    "recommendations. Be specific and cautious about small sample size.nn"
    + summary
)
Submitted to Claude Opus 4.8, this prompt produces structured, professional insights in seconds. The model identifies key risk vectors, notes the alarming refund velocity, and explicitly highlights the sample size constraints—demonstrating a sophisticated understanding of corporate reporting standards.
The Human-in-the-Loop Imperative
Despite the speed and eloquence of generative AI, automated tools lack business context and cannot independently verify underlying data integrity. An automated model cannot know whether a 38% refund rate is standard for a newly launched digital product or indicative of a critical fulfillment failure. Consequently, human oversight remains mandatory. The AI provides an exceptional first draft; the analyst ensures accuracy, context, and strategic alignment before the report reaches executive desks.
Future Outlook: The Evolution of Automated Enterprise Reporting
The integration of Python pipelines and generative artificial intelligence marks a fundamental turning point in corporate analytics. As these automated workflows mature, several key trends are shaping the future of business intelligence:
- Democratization of Data Engineering: Junior analysts and non-technical stakeholders will increasingly deploy pre-built Python templates, reducing their reliance on centralized data engineering teams for routine ad-hoc reports.
- Context-Aware LLMs: Future iterations of enterprise AI tools will integrate more deeply with internal enterprise data warehouses, allowing models to query historical baselines automatically and flag anomalies with greater contextual precision.
- End-to-End Dynamic Dashboards: Static HTML outputs will evolve into interactive, self-updating executive portals generated dynamically whenever a new dataset is uploaded to secure cloud storage.
By shifting the burden of data cleaning, chart generation, and narrative drafting to code and AI, organizations empower their data professionals to move away from reactive administrative tasks and focus on high-value strategic decision-making.
As noted by data science educator and StrataScratch founder Nate Rosidi, mastering these automated pipelines allows modern analysts to transform routine data processing into an efficient, repeatable competitive advantage.